
We are committed to the safety of the essential service workforces and the communities that they service. As the novel coronavirus sweeps the world, we wanted to see how the patterns of service workforces changed with government mandated social distancing.
On March 25th, India's Prime Minister Modi announced a shelter-in-place order for all states. This drastically reduced the movement of devices as the workforce trimmed to essential workers only.
“Every district, every lane, every village will be under lockdown. If you can’t handle these 21 days, this country will go back 21 years,” - Modi
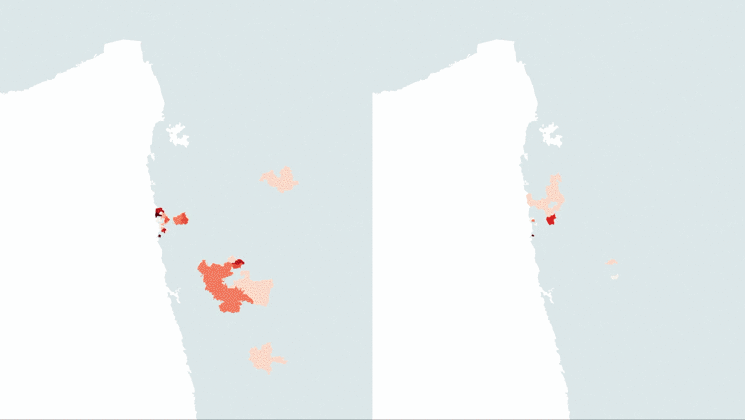
To illustrate this, we binned 100s of millions of location events to each Indian sub-district and animated this for every hour. The resulting visual, the heartbeat of India, reveals the ebbs and flows of service workforce movement. Comparing daily activities before and after the lockdown allowed us to dive deeper on the effect of COVID-19.
Delhi NCR and Greater Mumbai areas
In the week before the lockdown, the service industry is active and healthy in cities with lots of movement inside city centers. People accept deliveries to their place of work and field workforce continues visiting customers. Movement between nearby cities is frequent as people go about their daily commutes.
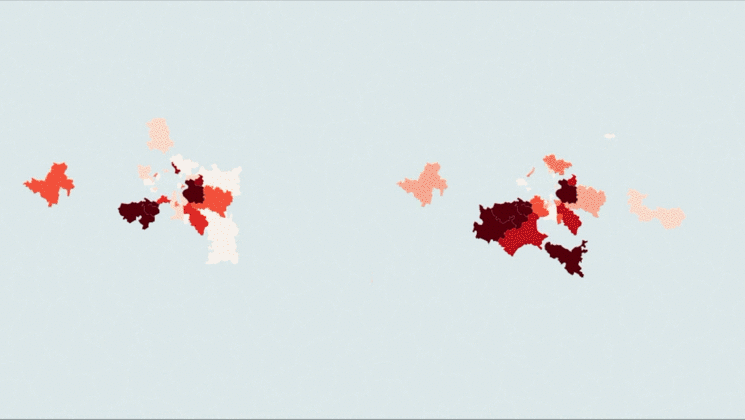
After the lockdown, essential service workers cater to those who live in the outskirts of the city. Travel between districts slows while city services shift towards the outskirts. Non-essential workers choose to migrate back to their home villages.
Flagging social distancing violations
The visuals paint a clear picture of the effect of COVID-19 on India's workforce. We wanted to take the data powering it and deliver actionable findings to our customers who manage the field workforce.
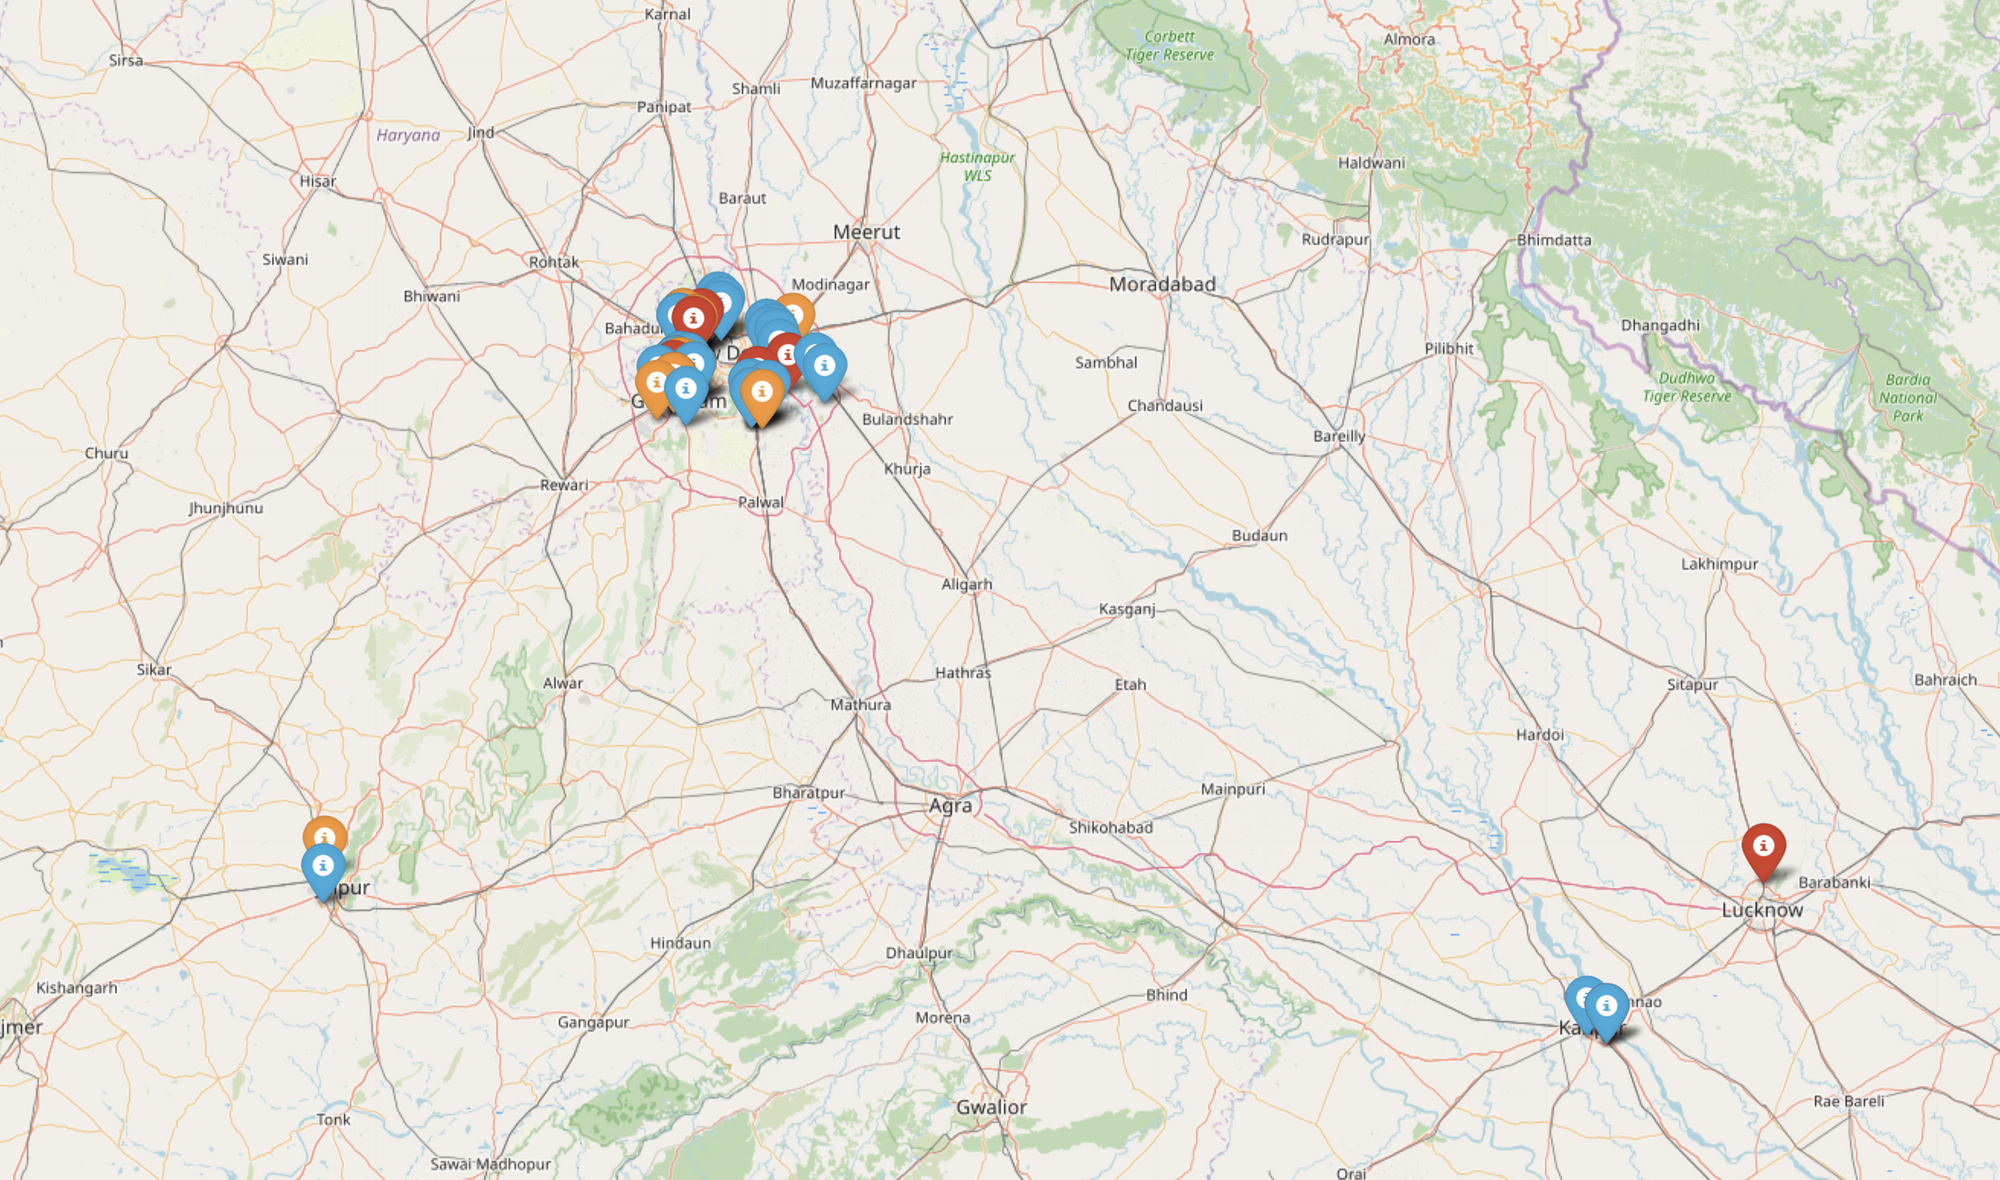
With our activity-enriched location data, we are able to accurately detect when multiple devices are stopped at the same time at the same location. This data allows our customers to identify potentially risky spots and help their workforce practice social distancing. Here is an example of the daily map we share with customers. Red indicates higher number of devices simultaneously at the same location.
Notifications for visits to inessential public places and hotspots
In addition to identifying areas of unwanted convening, we generated a list of inessential public places and potential hotspots. Upon nearing one of these places, the account owner is alerted and can act accordingly. We are working closely with public data sets to geofence hotspots as it evolves each day.
While most of the world is sheltered in place and maintaining social distancing, the essential service workers are out there to make our lives comfortable where we are. Besides our gratitude, they need our help to keep themselves, their customers and communities safe from the spread of the highly contagious virus. We must do everything in our capacities to flatten the curve and contain the spread until the world is ready to immunization so normalcy can prevail.
HyperTrack is available for free for any essential service workforces worldwide. We are committed to working together to overcome this crisis.

